GIS is a scientific framework for gathering, analyzing, and visualizing geographic data to help people make better decisions. On GIS Day, we’re helping others learn about geography and the real-world applications of GIS that are making a difference in our society and our city. We asked our leading GIS master Travis to tell us more!
So just what is GIS?
To start, at Casey Trees, we use geographic information systems (GIS) to assist in our mission of restoring, enhancing and protecting the tree canopy of the nation’s capital. GIS is a computer-based system that aids in the collection, maintenance, storage, analysis, visualization and distribution of spatial information. GIS is composed of both the hardware used to collect spatial/locational data (i.e. GPS or remote sensing device) and the software used to map and analyze the data (i.e. ArcGIS or QGIS). A major benefit of GIS and spatial analysis is that locational information helps tie together diverse and disparate data sources in a format that is easily interpretable (i.e. maps). With the use of the tools provided by GIS, we are better able to understand our environment and past efforts, which leads to better decision making.
How does Casey Trees use GIS?
Casey Trees uses GIS to gather data, create interactive online maps and applications, and produce analytics that guide decision-making.
Data Collection
Casey Trees began using GIS in 2005, soon after our founding in 2002, to create a digital record of our tree plantings. This original use has grown tremendously – we now use a custom ArcGIS online application to input the location of the trees we plant throughout the District.
Casey Trees’ Park Inventory program uses Collector for ArcGIS to gather comprehensive data regarding the location, species, size and condition of trees throughout D.C. parks. This information is shared with our partners at the Urban Forestry Division and the National Park Service to assist with tree care, maintenance and planning/planting efforts.
Interactive maps and apps
GIS applications are tools that allow users to create interactive queries, analyze spatial information, edit data in maps, and present the results of all these operations. Through our ArcGIS Online platform, Casey Trees hosts interactive online web maps and applications for both internal use and public consumption. Internally we have a variety of dashboards that connect to our GIS database and provide descriptive analytics regarding our tree planting and maintenance efforts (we track what trees we’ve watered to be sure we get to every tree during hot, dry summer stretches).
Externally, we publish a variety of web-based, interactive applications from thematic fall and flowering tree maps (which you hopefully know and love!) to our advocacy tracker that our Certified Tree Advocates use to keep up to date about development projects.
Analytics
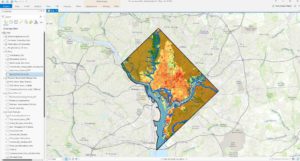
Spatial analysis seeks to explain patterns of natural or human behavior using their topological or geographic properties. Spatial analysis was first used in 1854 by Dr. John Snow (no, not that Jon Snow!) to identify and stop cholera outbreaks in London. At Casey Trees’ we utilize spatial analysis to identify land cover, find clusters or hot-spots, detect nearest neighbors, and produce map books. When launching our Save Our Soil campaign we used spatial analysis to help find areas that would benefit from additional preserved greenspace.
Want to get involved?
If you would like to learn more about GIS and GIS data collection, do we have a program for you. As a volunteer with our Park Inventory program, you’re using GIS to directly contribute information about our city’s trees that we use to inform our future planning efforts. If John Snow could see us now.