THE LEAFLET
Temperature Study
Clearly we love the topic of shade…since the D.C. summer heat is here to stay find a shady spot under a tree, and you will see for yourself — trees make your time outside almost 14 degrees cooler.
For the past two summers we have relied on volunteer citizen scientists to collect temperature data all over the district. With close to 50 volunteers and over 500 temperature readings, we were able to map some of these efforts.
We put the information in this interactive map that looks at the average temperature difference across various points in D.C.. Each thermometer shows the average temperature in the sun vs in the shade of a tree. The different shades of green represent what percent canopy coverage a certain neighborhood has: darker green means more canopy coverage, while lighter means less canopy coverage.
Although we can see some trends forming we need more data so we can make claims with confidence and accuracy. And in order to gain accuracy we need more participants in more wards taking more temperature readings.
We are calling on volunteers to help us conduct research. The research is citizen science based—which means anyone can help by collecting data.
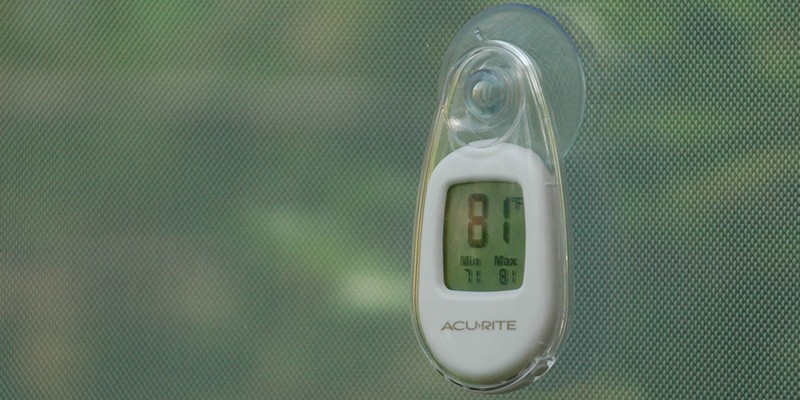
How it works – If you choose to participate, we mail you two thermometers. You will install them (using the suction cup provided) somewhere in the District – one in direct sun and one in the shade of a tree. After that, all you need to do is take 3-5 readings a week from mid-July through September and enter your findings into the online spreadsheet we provide.
How to apply – Simply visit our Temperature Study page and click ‘Apply Now’. The thermometers will be headed your way after you answer a few short questions.