The Leaflet
The 2024 Canopy Awards are Almost Here!
Arbor week is here! As we approach Arbor Day Eve, the excitement is building for the highly anticipated 2024 Canopy Awards. This spectacular event isn’t just another gathering; it’s our …
read more
Apr. 22 2024
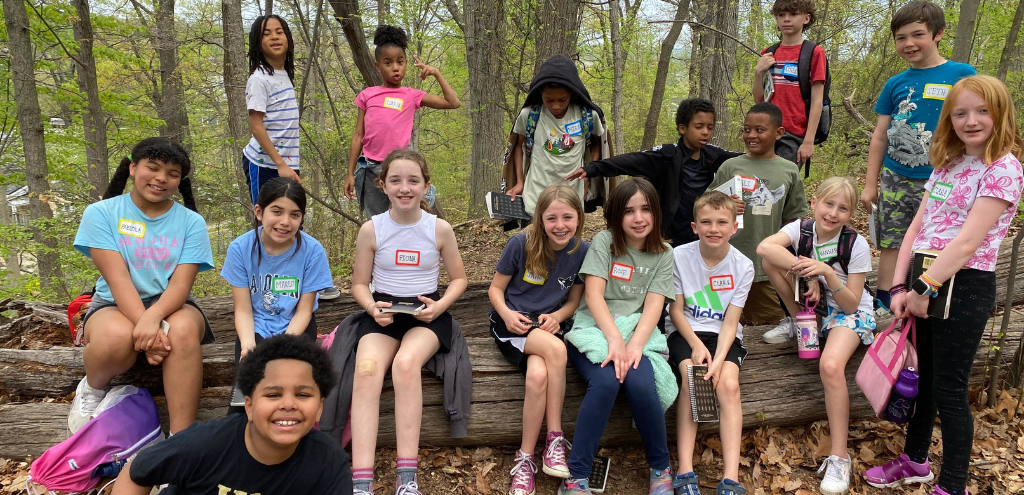
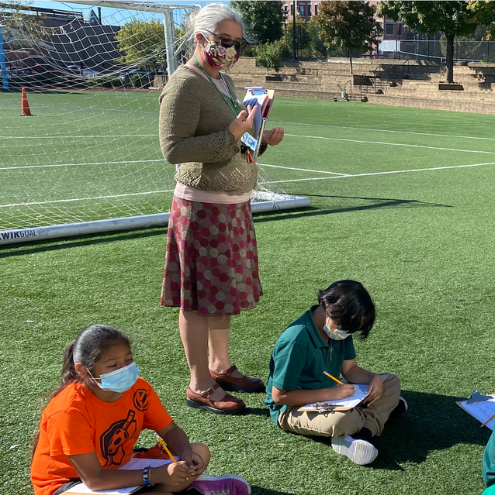
Treewise Sparks Excitement Among Young Urban ForestersCasey Trees’ Treewise Spring Break Camp, “Every Day is Arbor Day,” proved to be a resounding success as young nature enthusiasts delved into the wonders of Washington, DC’s urban forest. …
Apr. 22 2024
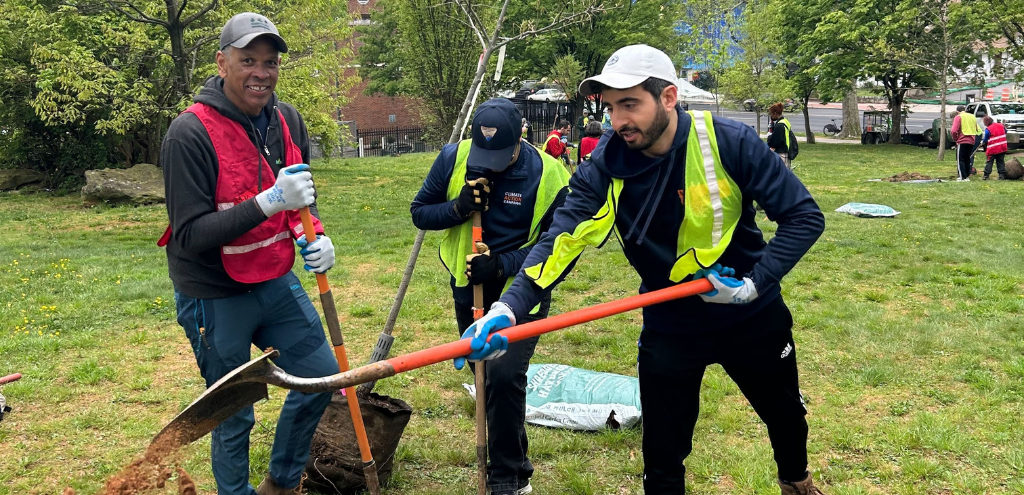
Celebrating a Busy Earth DayAs the world celebrates Earth Day, communities worldwide are coming together to act towards a greener, more sustainable future. Last Saturday, volunteers gathered at Emery Recreation Center with one common …
Apr. 15 2024
Meet the Honorees: Pat SpillmanAs the anticipation builds for this year’s Canopy Awards, we take a moment to celebrate our esteemed Honoree for Volunteer Service, Pat Spillman. Pat’s dedication to serving our community and …
SEARCH
Apr. 15 2024
Join us for the End of Spring!
We have had a wonderful start to our spring season, and we are moving forward with plenty more events and ways for you to join us this season. We hope …
Apr. 15 2024
The tree giveaway has concluded, and we’re thrilled to share that over 200 trees have been distributed to enthusiastic tree lovers! And all within just two days! These saplings are …
Apr. 8 2024
Meet the Honorees: Bartlett Tree Research Laboratories
As the excitement mounts for this year’s Canopy Awards, we continue to explore the remarkable achievements of our distinguished honorees. This week, we’re shining a spotlight on Bartlett Tree Research Laboratories, …
Apr. 8 2024
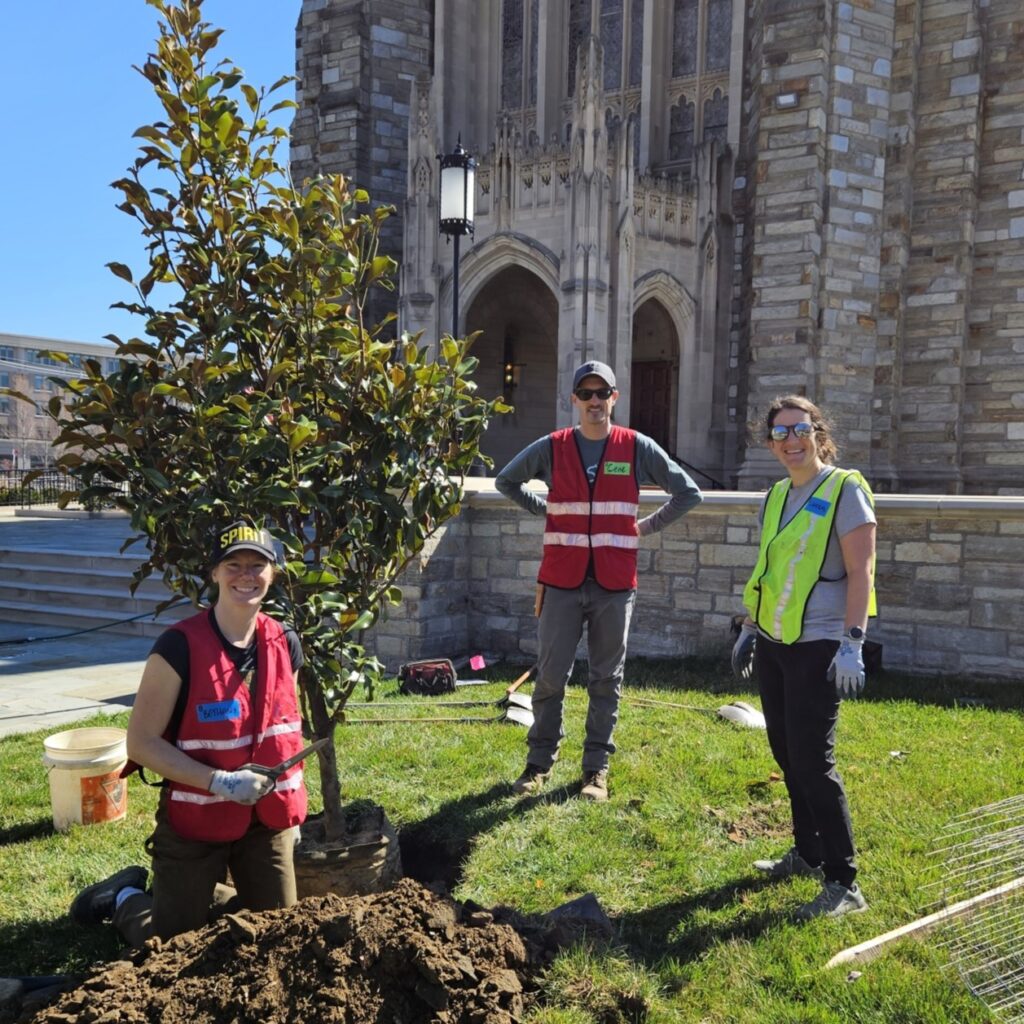
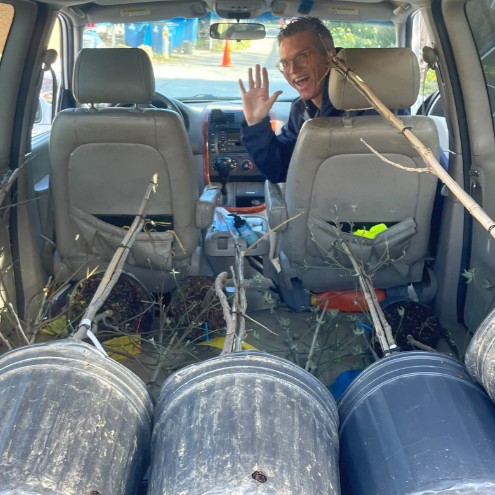
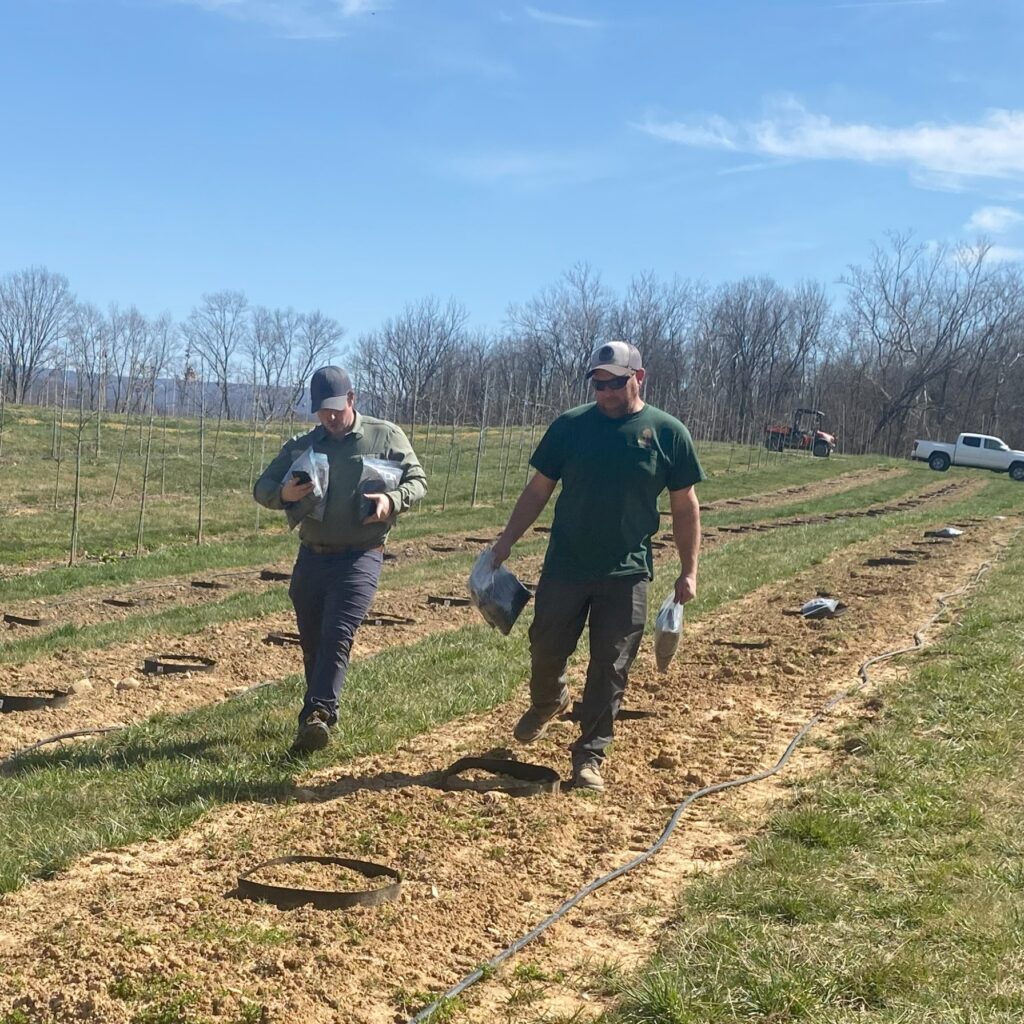
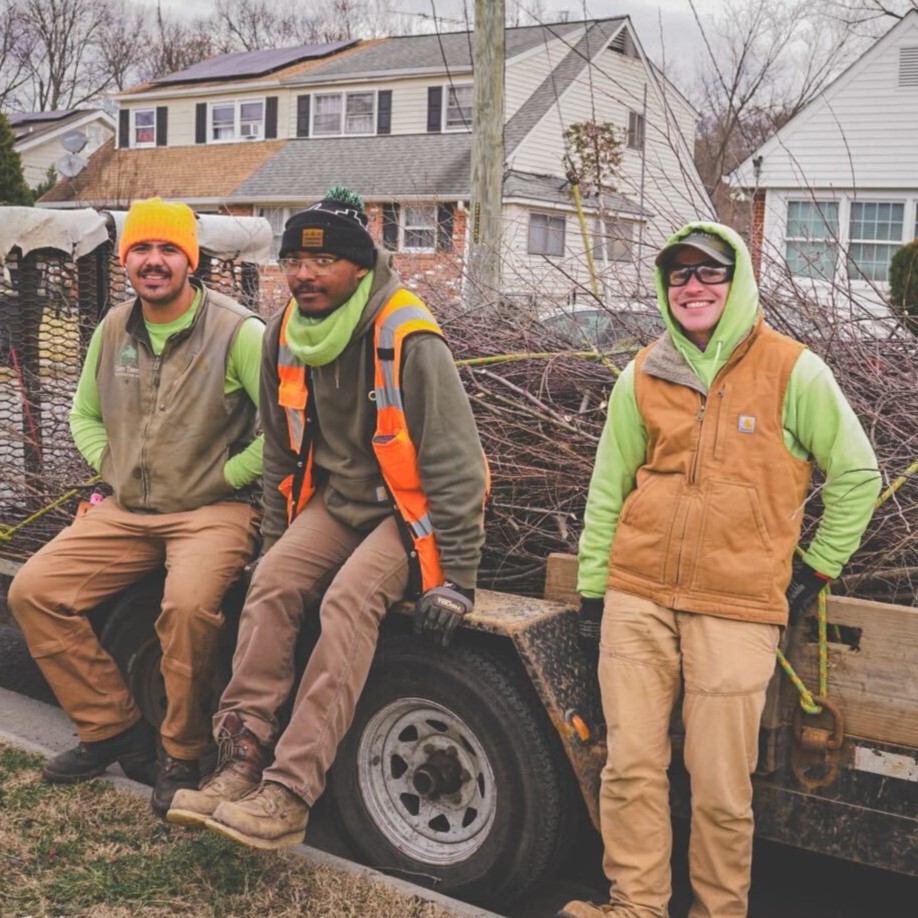
A Look into the Busy Planting Season
As the planting season kicks into high gear, it’s time to shine a spotlight on Casey Trees’ dedicated Tree Operations crew. Our team works tirelessly to restore, enhance, and protect …
Apr. 8 2024
Meet the Student Conservation Association
At Casey Trees, our commitment to environmental education is unwavering. We firmly believe in empowering the next generation with the knowledge and skills to become stewards of our planet. We …
Apr. 1 2024
As the summer months quickly approach, it’s important that our trees receive appropriate amounts of water to keep them thriving through any upcoming heat waves and dry spells. That’s why …
Apr. 1 2024
As anticipation builds for the annual Canopy Awards, we continue to explore and learn about our esteemed honorees. Today we’ll be getting to know Megan Fisk, a beacon of environmental …
Apr. 1 2024
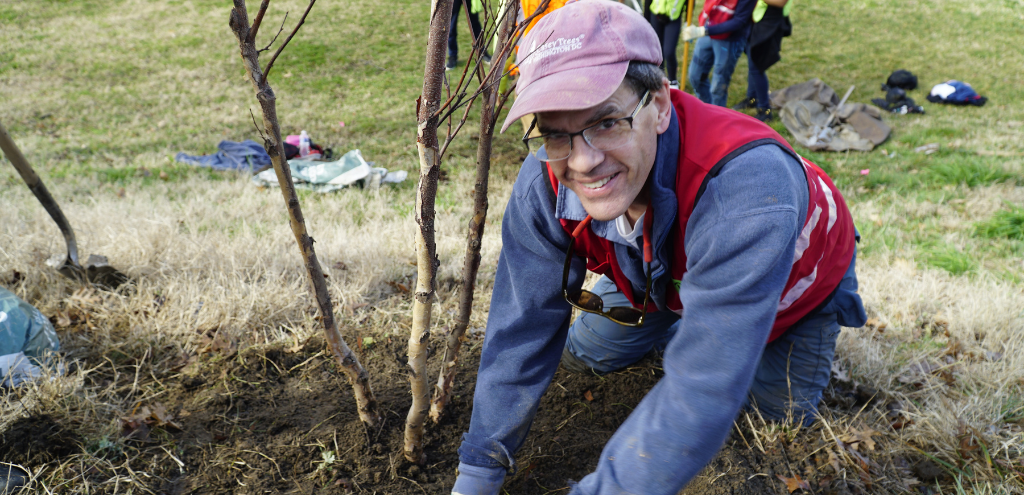
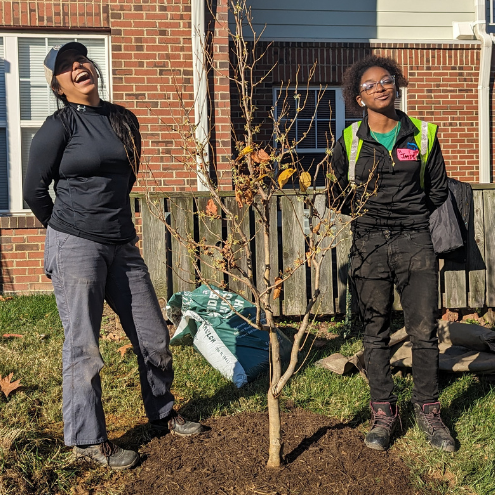
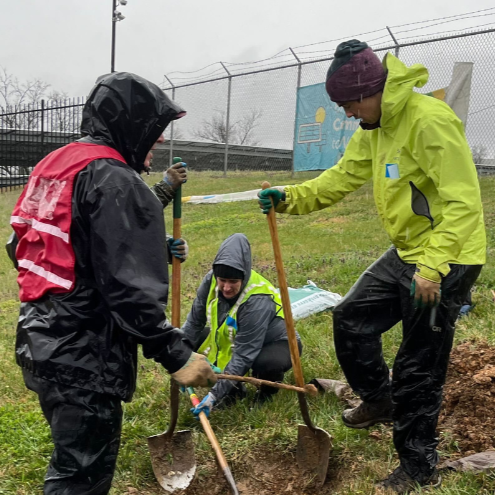
Recapping a Rainy Tree Planting + Meet the Honorees: Bloom
Last weekend, despite the challenging weather conditions, volunteers gathered with unwavering dedication to participate in the community tree planting event. Braving the rain, they diligently worked to add 38 trees …